Every campaign wrap-up leaves behind a dashboard full of percentages, costs, and acronyms. For marketing teams, these numbers reveal which ads captured attention and which channels generated leads. But the conversation changes when the report reaches senior leadership.
The question is no longer just how much a click or lead cost. Business leaders need to understand whether marketing investment contributed to revenue, profit margins, and sustainable growth. Metrics such as CPC, CPL, CPV, and CTR help teams optimize campaign performance, but they cannot tell the whole business story on their own.
The challenge is not to add more indicators to a dashboard. It is to build a measurement framework that connects campaigns, the customer journey, and financial outcomes. A digital strategy aligned with business objectives gives every KPI a clear purpose: supporting better decisions.
This guide explores the marketing metrics businesses need at different decision-making levels. Learn how ROI differs from ROAS, how CAC and LTV provide additional financial context, and how to build marketing reports that support smarter budget allocation.
What Metrics Should a Marketing Report Include?
An effective marketing report brings together three levels of measurement: operational metrics that help optimize campaigns, funnel metrics that assess the customer journey, and financial metrics that guide investment decisions.
These levels complement one another. Each answers a different question, and none provides a complete picture on its own.
Marketing Metrics by Decision-Making Level
| Level | Key metrics | Decisions they support |
|---|---|---|
| Campaign performance | CPM, CPC, CPV, CTR, reach, and frequency | Optimize bids, audiences, ad formats, and creative assets. |
| Sales funnel | Conversion rate, CPL, qualified leads, and close rate | Identify where opportunities lose momentum or value between initial engagement and conversion. |
| Business performance | Revenue, contribution margin, ROAS, ROI, CAC, LTV, payback period, and incrementality | Allocate budgets, evaluate profitability, and assess sustainable growth. |
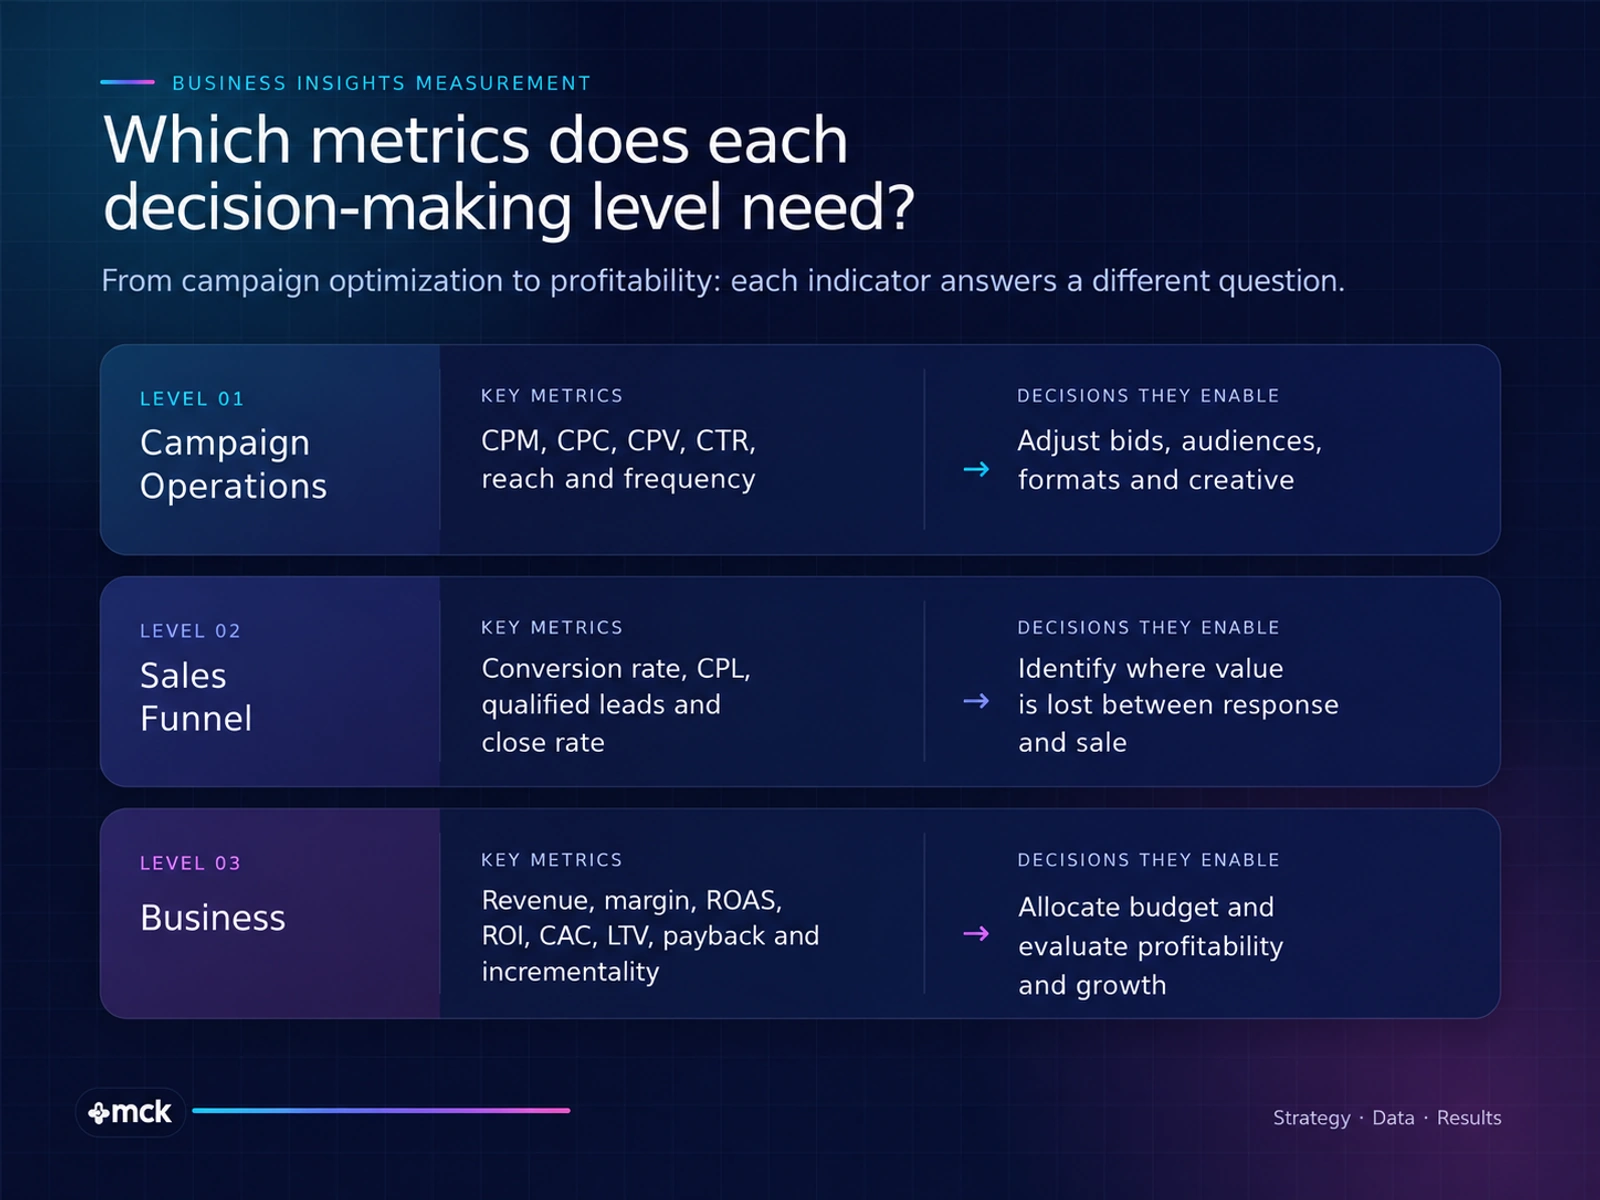
CPC and CTR should not be presented in isolation during an executive review, but they can help explain why performance changed. Conversely, waiting until the end of a quarter to assess ROI before optimizing an active campaign would be too slow. Effective measurement connects real-time optimization with longer-term financial evaluation.
What Is the Difference Between ROI and ROAS?
ROAS (Return on Ad Spend) measures the revenue or conversion value attributed to advertising relative to advertising spend. ROI (Return on Investment) evaluates the financial return after accounting for the relevant costs and, ideally, the incremental contribution margin generated by the investment.
Both metrics help assess marketing profitability, but they answer different questions. A high ROAS does not necessarily mean a campaign is profitable.
How Do You Calculate ROAS?
Return on ad spend measures the revenue attributed to advertising for every unit of advertising spend:
ROAS = Revenue attributed to advertising ÷ Advertising spend
ROAS can also be expressed as a percentage by multiplying the ratio by 100. For example, a 500% ROAS means that advertising generated five units of attributed conversion value for every unit spent. In a Mexican peso context, that is MXN $5 in conversion value for every MXN $1 invested.
To interpret ROAS consistently, define what the reported conversion value represents, use a consistent measurement approach, and account for the limitations of attribution. Attributed revenue is not necessarily revenue caused by advertising.
How Do You Calculate Marketing ROI?
A contribution-margin-based formula provides a more useful view of marketing's financial return than revenue alone:
Marketing ROI = (Incremental contribution margin − Total marketing investment) ÷ Total marketing investment × 100
Total marketing investment may include media spend, creative production, technology, agency fees, and other relevant costs. Using contribution margin rather than revenue helps account for the costs associated with generating sales.
Practical example:
- Media spend: MXN $200,000
- Operating and production costs: MXN $50,000
- Total marketing investment: MXN $250,000
- Sales revenue: MXN $1,000,000
- Contribution margin: 40%, equivalent to MXN $400,000
The calculation is:
Marketing ROI = ($400,000 − $250,000) ÷ $250,000 × 100 = 60%
In this example, marketing ROI is 60% based on the stated contribution margin and total investment, assuming the margin is attributable to the marketing activity being evaluated.
A 5x ROAS can still coincide with a negative ROI when product margins are low or other costs are high. For that reason, leadership should review both metrics rather than treating them as interchangeable measures of success.
Which Financial Metrics Complement ROI and ROAS?
ROI and ROAS become more useful when interpreted alongside unit economics. Customer acquisition cost, customer lifetime value, payback period, and incremental revenue help businesses understand whether growth is sustainable and how much value marketing creates.
Customer Acquisition Cost (CAC)
Customer acquisition cost (CAC) measures how much a business spends to acquire a new customer. It is calculated by dividing the relevant sales and marketing acquisition costs by the number of new customers acquired during the same period.
CAC = Sales and marketing acquisition costs ÷ Number of new customers acquired
Including only media spend can understate the true cost of acquisition. Depending on the business model, the calculation may also need to account for creative production, agency fees, sales expenses, and other acquisition-related costs.
Customer Lifetime Value (LTV) and Payback Period
Customer lifetime value (LTV) estimates the value a customer generates over the course of the relationship. For financial planning, a margin-based LTV is often more useful than a revenue-only estimate.
Comparing LTV with CAC helps assess whether customer acquisition is economically sustainable. The payback period adds another dimension: how long it takes for the margin generated by a customer to cover the acquisition cost.
A simplified LTV formula is:
LTV = Average contribution margin per period × Expected number of periods the customer remains active
A simplified payback formula is:
Payback period = CAC ÷ Average monthly contribution margin per customer
These formulas are starting points. Actual calculations should account for the business model, customer retention patterns, variable costs, and the time value of money where relevant.
Incremental Revenue
Incremental revenue estimates the additional revenue generated because of a marketing activity compared with what would likely have happened without it.
This distinction matters because attribution and incrementality are not the same thing. Attribution assigns credit to marketing touchpoints according to a defined model. Incrementality seeks to estimate causal impact, often through controlled experiments or other methods designed to establish a credible counterfactual.
A campaign can receive attribution credit without generating an equivalent amount of additional business. Understanding this difference helps teams evaluate whether marketing is creating new value or capturing demand that would have existed anyway.
How Do You Build a Marketing Measurement System?
A marketing measurement system should start with a business decision, not with the columns available in an advertising platform. It needs clear financial objectives, an agreed definition of the sales funnel, connected data sources, an attribution approach, and methods for assessing incremental impact.
1. Define the Business Outcome
Start by deciding what the business needs to achieve: revenue growth, higher contribution margin, new customers, improved retention, or another measurable outcome. Distinguish short-term performance from long-term effects.
As discussed on CEO Digital in “Strategy and Content Creation: Where Is the Return on Investment for the Brand?”, separating these time horizons helps prevent short-term decisions from undermining longer-term brand and business objectives.
2. Map the Customer Journey and Sales Funnel
Document each stage of the funnel, the events that indicate progress, the teams responsible, and the criteria used to qualify opportunities. This makes it easier to identify where potential customers move forward, drop off, or lose value.
As explored in the CEO Digital episode “Is the Sales Funnel Dead?”, each stage serves a purpose in understanding the buying journey.
Before introducing more sophisticated measurement, the MCK Digital Maturity Matrix can help identify gaps in data, processes, and capabilities that limit the quality of the analysis.
3. Connect Your Data Sources
Integrate advertising platforms, web analytics, CRM systems, e-commerce data, and sales records to create a more complete view of performance. Establish consistent definitions across sources and reconcile key figures with Finance.
Without this foundation, teams may report conflicting results, double-count conversions, or mistake differences in measurement for changes in business performance.
4. Distinguish Attribution from Incrementality
Attribution helps explain how credit is assigned across marketing touchpoints. To estimate the additional impact of marketing investment, businesses can complement attribution with experiments and Marketing Mix Modeling (MMM).
Through MCK Cloud View, MCK helps bring these analyses into media planning and performance operations, so insights can inform investment decisions, forecasting, and budget optimization.
5. Forecast Outcomes and Make Decisions
Use historical results and relevant business factors to develop forecasts. Account for seasonality, conversion delays, sales capacity, and diminishing returns as investment increases.
A useful forecast should make its assumptions explicit, compare plausible scenarios, and show how each scenario could affect the business outcome. Its purpose is not just to predict performance, but to help leaders decide where to invest next.
Google recommends using attribution, incrementality, and Marketing Mix Modeling as complementary measurement approaches, supported by reliable data. The right combination depends on the business model, available data, resources, and the decisions the analysis needs to inform. Learn more about first-party data and its role in marketing measurement.
How Should You Present a Marketing Report to Leadership?
An executive marketing report should connect four elements: the business objective, the result, the explanation, and the next decision. Leaders need to understand what changed, how confident the team is in its interpretation, and where resources should be allocated or reallocated.
An executive dashboard can summarize:
- Financial performance against the business goal.
- Total marketing investment.
- ROI and ROAS.
- CAC and customer acquisition payback.
- Forecasts and projected outcomes.
Operational metrics such as CPC, CPL, CTR, conversion rate, and close rate provide the diagnostic detail needed to explain those results. They should support the business narrative, not replace it.
The Totalplay Brandformance case study illustrates how connecting brand awareness with performance marketing can improve results across the funnel. The strategy increased leads by 169% year over year and reduced cost per lead by 26%.
These results demonstrate improvements in lead generation and acquisition efficiency. To assess the full financial impact, they should also be interpreted alongside lead quality, sales conversion, contribution margin, and total investment.
How MCK Connects Marketing Metrics to Business Outcomes
At MCK Agency, we approach measurement as a system that connects business strategy, data, technology, and marketing investment. The goal is not simply to build dashboards. It is to define what matters, measure it consistently, and turn the resulting insights into better business decisions.
Our MCK Strategy team starts with the business model and commercial priorities to establish objectives, KPIs, and measurement criteria. The first question is not which metric to report, but what the business needs to understand to make a better decision.
MCK Engineering builds the technical foundation for that view through measurement planning, web analytics, platform integrations, CRM and MarTech ecosystems, Business Intelligence, and dashboards that connect information across sources.
When the challenge is to understand media contribution and determine where to invest, Cloud View, MCK's Marketing Mix Modeling solution, analyzes historical data and scenarios to support forecasting, budget allocation, and optimization across media and performance operations.
Together, MCK's teams create a more connected approach to marketing measurement, helping businesses move from isolated platform metrics to a clearer view of performance and financial outcomes.
If your business needs to move beyond platform reporting and develop a more complete view of marketing effectiveness and profitability, let's build a measurement and growth plan together.
Let's get results together.